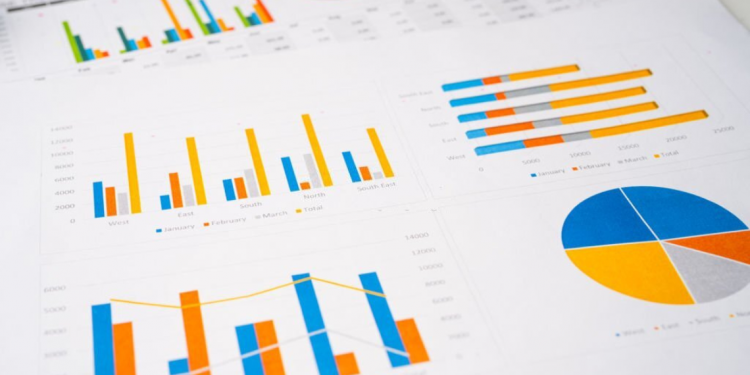
Charts are important for data visualization in business because they help businesses quickly and easily understand data. In particular, charts can help businesspeople see patterns and trends in their data. Additionally, charts can help businesses see how different pieces of data are related to one another. Finally, charts can help businesspeople to spot problems and opportunities in their data.
Today, we’ll take a look at one chart in particular; the stacked bar chart. Keep reading to learn more about stacked bar charts and how they can help your business with data visualization.
What are stacked bar charts?

First and foremost, let’s answer the question, “What is a stacked bar chart?” A stacked bar chart is a type of chart that displays data as bars. The bars are typically stacked on top of each other, with the height of each bar representing the value of the data. This type of chart is often used to compare different data sets, or to compare data values at different points in time. Stacked bar charts are similar to vertical bar charts, however, the bars in a stacked bar chart are usually displayed horizontally and segmented with each segment representing a different data set, while the bars in a vertical bar chart are typically displayed vertically and aren’t segmented.
Stacked bar graphs are excellent tools for comparing proportions.

When trying to compare proportions, stacked bar charts are an excellent choice. This is because they clearly show how much of each category is represented, as well as how they compare to each other. This makes it easy to see which category is the biggest, and how much it differs from the others.
For example, imagine you are a business owner trying to decide whether to offer a new product. You want to know how much interest there is in the product, so you create a survey and ask your customers how likely they are to buy it. You can then use a stacked bar chart to compare the proportions of customers who said they were very likely, somewhat likely, and not likely to buy the product.
This chart makes it easy to see that most of your customers are not likely to buy the product, but there is still some interest. It can also help you determine which group you should focus on when trying to increase sales of the product. If you want to increase the number of customers who are very likely to buy the product, you should focus on the group that is most interested.
Stacked bar charts work well when displaying data over time.

Stacked bar charts are ideal for displaying data over time. This type of chart is perfect for visualizing how a particular item has changed over a period of time. Additionally, stacked bar charts can help you track progress towards a goal.
For example, let’s say you’re a manager at a company and you’re trying to increase sales by 20 percent over the next year. You can use a stacked bar chart to track your progress towards this goal. The chart would show the percentage of increase in sales each month, and you could see at a glance whether you’re on track to meet your goal.
How do you create a stacked bar graph?

To create a stacked bar chart in Excel, you will need to first create two columns of data in a spreadsheet. The first column should list the categories for the data, and the second column should list the corresponding data points. Once you have created the two columns of data, you can then create a stacked bar chart by selecting the data and clicking on the “Insert” tab, and then selecting the “Bar” chart type. Excel will then create a bar chart with the data displayed as stacked bars. You can then customize the chart by formatting the bars, changing the title, and adding axis labels and a legend.
Consider using a stacked bar chart for your data visualization needs.
A stacked bar chart is an important tool for data visualization as it allows for the comparison of data values within a category as well as across categories. Overall, stacked bar charts are an effective way to compare and contrast data values.


